Performance
zloop is faster than uvloop on the workloads that matter most for real servers. This page leads with uvloop's own benchmark (the fairest comparison there is), then shows lower-level micro-benchmarks, and is honest about the caveats.
uvloop's own benchmark
The most credible way to compare against uvloop is to run uvloop's benchmark.
So that's what we do: uvloop ships an echo-server benchmark in
examples/bench,
with three server styles - proto (a raw asyncio.Protocol), buffered (a
BufferedProtocol), and streams (the high-level streams API) - driven by a
multi-process client that measures requests/second.
We run it unchanged, except for adding a --zloop flag to the server that
mirrors the existing --uvloop one. The client is byte-for-byte uvloop's.
zloop has two backends - the default readiness reactor (epoll/kqueue) and the
opt-in io_uring completion backend (ZLOOP_IO_URING=completion, Linux only).
Both are shown in every table below; the fastest in each row is bold.
Single loop (the default, GIL on)
Results (Linux, CPython 3.14, 3 workers, best of 3), requests/sec:

| mode | size | asyncio | uvloop | zloop epoll | zloop io_uring |
|---|---|---|---|---|---|
| proto | 1 KB | 135,393 | 127,872 | 132,223 | 138,778 |
| proto | 100 KiB | 61,441 | 57,158 | 66,188 | 22,280 |
| streams | 1 KB | 105,250 | 116,043 | 122,236 | 116,720 |
| streams | 100 KiB | 43,312 | 40,582 | 46,862 | 19,679 |
For a single GIL-bound loop the default epoll backend beats uvloop. The io_uring completion backend is slower here: its submit/reap overhead and the 64 KiB buffer-ring copy aren't amortized when one serialized loop is the bottleneck, and it fragments 100 KiB messages badly. Completion's win is parallel free-threaded loops (below).
About large (100 KiB) messages
At 100 KiB the readiness loops converge - zloop epoll, uvloop, and even asyncio land within a few percent of each other. At that size the test measures loopback bandwidth, not the event loop, and the numbers swing run-to-run (we saw asyncio's streams read 42k one run and 24k the next). The row is included for completeness, but to measure large-message behavior meaningfully you need real hardware, not loopback.
Free-threaded parallel loops (GIL off)
Under free-threaded CPython (3.14t), N independent loops on N threads stop being serialized by the GIL - and the completion backend, whose io_uring path is leaner, beats uvloop at every thread count (and beats zloop's own epoll default everywhere).
N loops on N threads, 8 conns/thread, 1 KB messages, Linux io_uring kernel 6.10, 3-sample medians on a 12-CPU host, requests/sec:
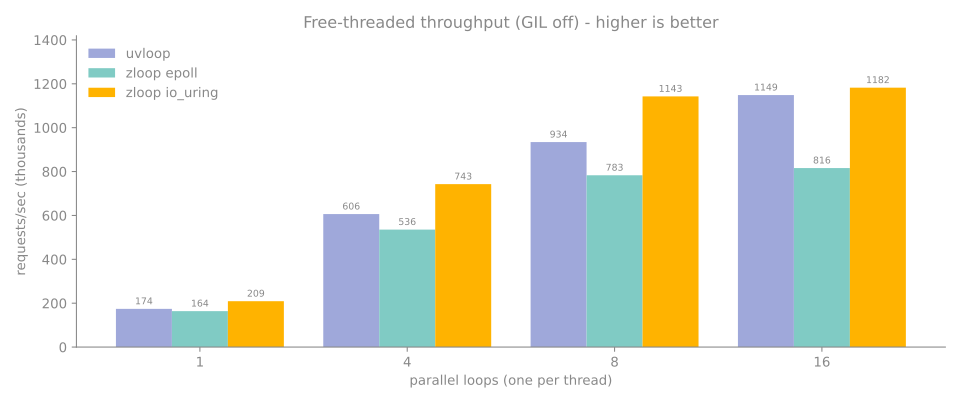
| loops | uvloop | zloop epoll | zloop io_uring |
|---|---|---|---|
| 1 | 174,185 | 163,900 | 209,071 |
| 4 | 606,261 | 535,556 | 742,847 |
| 8 | 934,289 | 783,205 | 1,142,655 |
| 16 | 1,148,609 | 815,971 | 1,182,234 |
The wins come from keeping the io_uring path lean: batched submits (one
io_uring_enter per loop turn, not per op), multishot recv,
completion-path writes (SEND on the ring, no per-message write()), and a
cached protocol.data_received (a per-message attribute lookup was taking
per-object locks and causing a sched_yield storm across parallel free-threaded
loops). uvloop runs here too - it imports on 3.14t without forcing the GIL back
on and drives one loop per thread.
These io_uring numbers are directional
The completion backend is Linux-only and these results were measured in a kernel-6.10 VM, not on bare metal. The 16-loop margin (+3%) is the thinnest and noisiest - 16 loops oversubscribe the 12-core host - so the solid wins are at 1-8 loops.
Reproduce it
The harness lives in bench_uvloop/:
CI runs the same matrix via bench_uvloop/bench_ci.py and writes
bench_uvloop/results.json, from which docs/render_bench.py regenerates the
chart and both tables. (The chart and CI table cover the single-loop matrix; the
free-threaded numbers come from bench_uvloop/ft_parallel_bench.py on a
python3.14t build with ZLOOP_IO_URING=completion.)
Micro-benchmarks
Beyond echo throughput, these isolate individual loop operations (each in its own
process; bench.py reports the best of several warmed-up runs):
| Workload | asyncio | uvloop | zloop | zloop vs uvloop |
|---|---|---|---|---|
call_soon (schedule + run) |
2.4 M/s | 4.2 M/s | 6.1 M/s | +46% |
call_later (timers) |
0.6 M/s | 3.6 M/s | 4.0 M/s | +12% |
create_future |
~0.04 M/s | ~0.04 M/s | ~0.04 M/s | tie |
create_future is a genuine tie because all three loops reuse CPython's
C-accelerated asyncio.Future - there's nothing there to differentiate. See
What zloop reuses.
Reproduce with python bench.py in the repository.
Where the speed comes from
It's not magic, it's doing the per-callback work in Zig and avoiding Python-level overhead on the hot paths:
- The contextvars work goes through the raw C-API (
PyContext_Enter/PyContext_Exit/PyContext_CopyCurrent) instead of the Python-levelcontext.run()andcontextvars.copy_context(). This was the single biggest win for timers and scheduling. - Reads are zero-copy: a socket read goes straight into a freshly allocated
bytesobject that's then shrunk to size, with no intermediate buffer copy. - The hot asyncio callables are cached (
Future,Task,ensure_future) instead of being re-imported on every call. - I/O readiness callbacks are native Zig closures - a socket becoming readable doesn't make a round trip through Python just to learn a byte arrived.
- The timer heap and ready queue live in Zig, with no per-operation Python allocation.
Caveats, stated plainly
Benchmarks are easy to get wrong, so:
- Loopback, not the network. These numbers come from a single GitHub Actions Linux runner over loopback. uvloop's published "2 to 4x faster than asyncio" is a Linux number too, but on a shared loopback the spread is much tighter (even uvloop barely beats asyncio above). Run it on your own target before relying on the exact figures.
- Run-to-run variance is real (~10%). The 1 to 10 KiB lead is reproducible; exact figures wobble.
- Measure each metric in isolation. Running everything back-to-back in one process degrades the later measurements and produces misleading ratios.
- The io_uring completion backend is Linux-only and its free-threaded numbers were measured in a kernel-6.10 VM, not on bare metal - treat the parallel-loop speedups as directional, and confirm on your own hardware.